Onfooting
I built Onfooting to turn bank statements into a clearer picture of spending and practical next steps toward savings goals.
- Next.js, TypeScript, Python, FastAPI, PostgreSQL
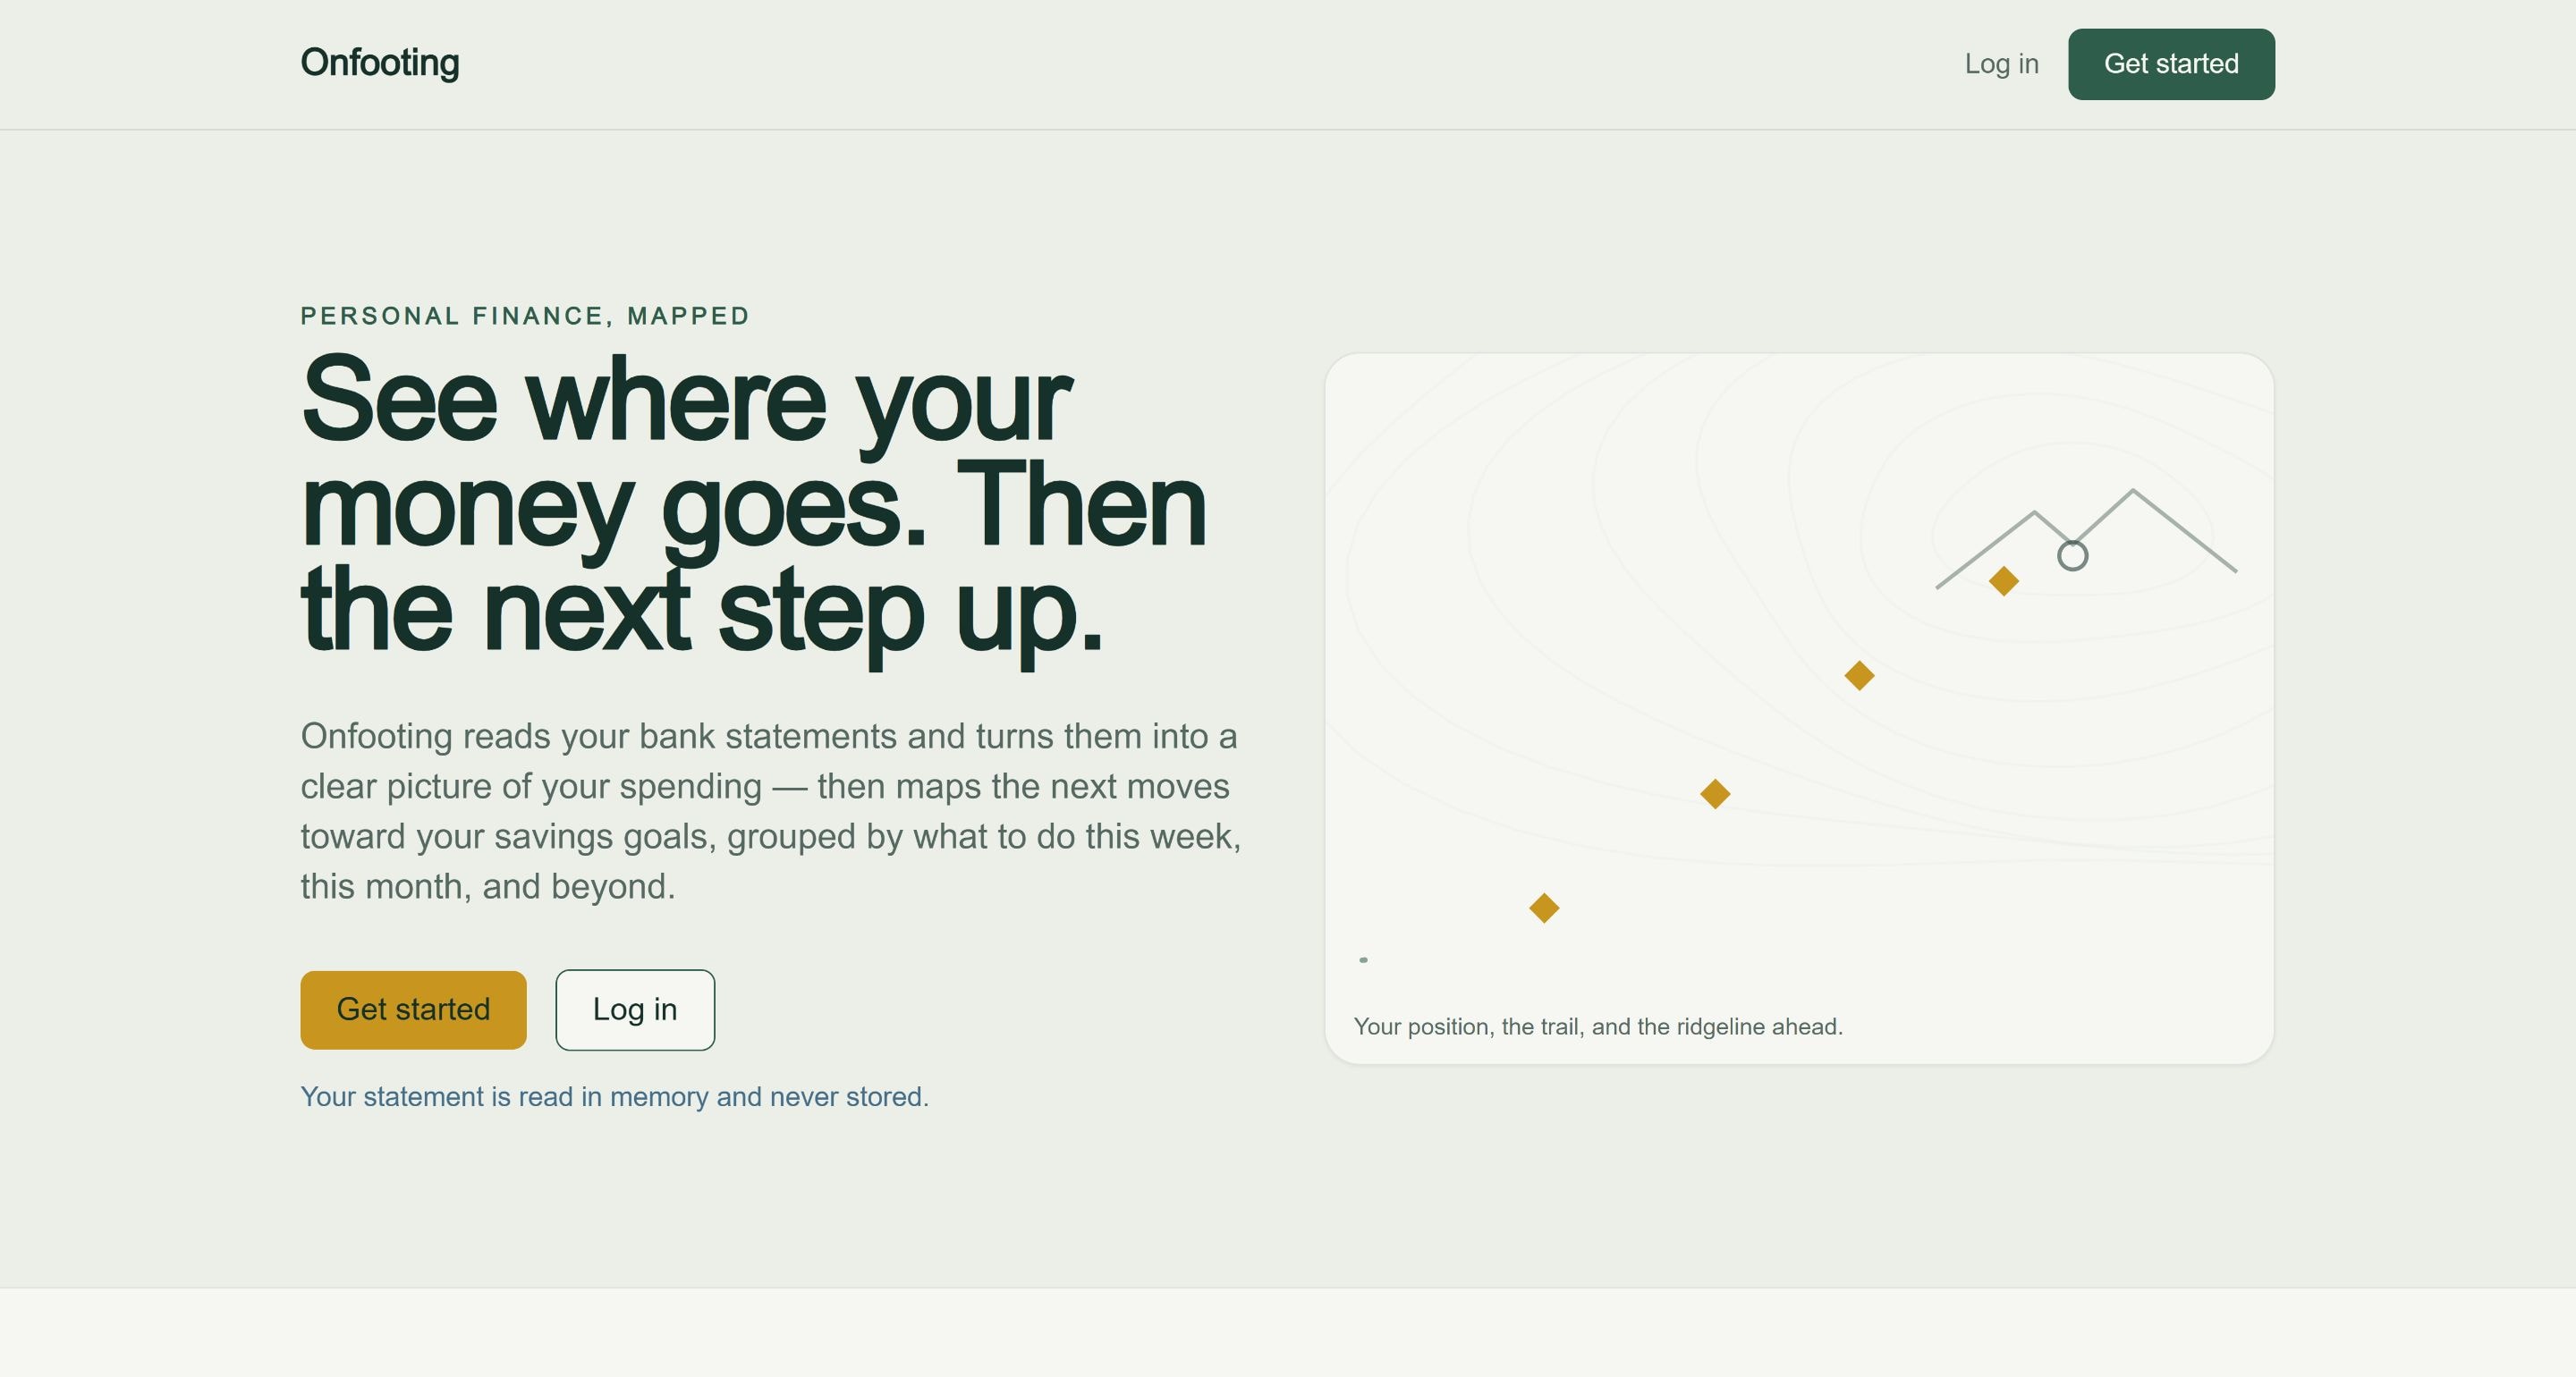
A bank statement records what happened. I wanted to make it easier to understand what could happen next.
Onfooting in action
Read the walkthrough
- Upload a bank statement to get started.
- Onfooting organizes your transactions, showing where your money goes.
- Compare your income, spending, and remaining balance in one view.
- Set a savings goal, and see your progress toward it.
- Then explore a change. Cutting this sample dining budget by twenty-five percent saves a hundred dollars a month, or twelve hundred a year.
From transactions to a plan
Onfooting brings statement uploads, transaction categorization, spending summaries and savings goals into one place. The aim is to connect the numbers to decisions: where money is going, what could change, and how those changes relate to a goal.
I developed the project under the name FinanceIQ before giving it the Onfooting identity. The product pairs a financial overview with recommendations organized by time horizon, from steps to take this week to longer-term changes.
How it works
Bring in a statement
Upload a bank statement. The parsing pipeline extracts transactions and normalizes dates, amounts and merchant descriptions.
See where the money goes
Review categorized spending, recurring transactions and progress toward savings goals. Category corrections help make later imports more useful.
Explore the next step
Compare spending with benchmarks and use what-if scenarios to explore how a change in one category could affect a goal.
A map for progress
The visual language treats money as terrain: contour lines, a trail, a current position and higher ground ahead. The map connects the brand to the product, with markers for this week, this month, ongoing habits and structural changes.
A restrained palette of green, stone and gold keeps the interface calm. The goal is to give people a clear place to start and a sense of direction.
Behind the interface
- Next.js, React, TypeScript and Tailwind CSS
- Python, FastAPI, SQLAlchemy and PostgreSQL
- PDF and CSV parsing, merchant normalization and transaction categorization
- Recharts for financial charts; SVG and GSAP for the animated terrain map